Stock pitch · Utkarsh Vaibhav · 4 October 2026 · India capital goods

CG Power and Industrial Solutions (NSE: CGPOWER)

SELL
TP ₹402 · price ₹879 · −54%

A strong business priced for a decade it has never delivered: ₹879 needs ~35% revenue growth a year for ten years at a 12% free-cash-flow margin.

Three reasons

  1. The price implies an extreme path. A reverse DCF at a 14.8% WACC puts FY36 revenue at ~₹2.5 lakh Cr, 20x FY26 and 5.7x the combined FY26 revenue of ABB India, Siemens, Hitachi Energy India and GE Vernova T&D India. It also needs a 12% FCF margin every year, matching CG's single best year since FY22. At an 11% WACC the price still needs 25% growth for a decade.
  2. Cash is not keeping up with profit. FY26 receivables +46% vs revenue +25%; operating cash flow was 43% of EBITDA; free cash flow −₹72 Cr as capex reached 6% of revenue. The semiconductor business cost ₹111 Cr in FY26 and ₹43 Cr in Q1 FY27 alone. Q1 growth slowed to 14% (Industrial Systems +6%), with EBITDA margin at 12.1%.
  3. Expensive even against expensive peers. CG trades at 115x FY26 P/E and 82x EV/EBITDA against peer medians of 86x and 65x. At peer multiples it is worth ₹682 (−22%; −17% on trailing twelve months to June 2026); our DCF gives ₹122 (−86%). Either method alone is a SELL.
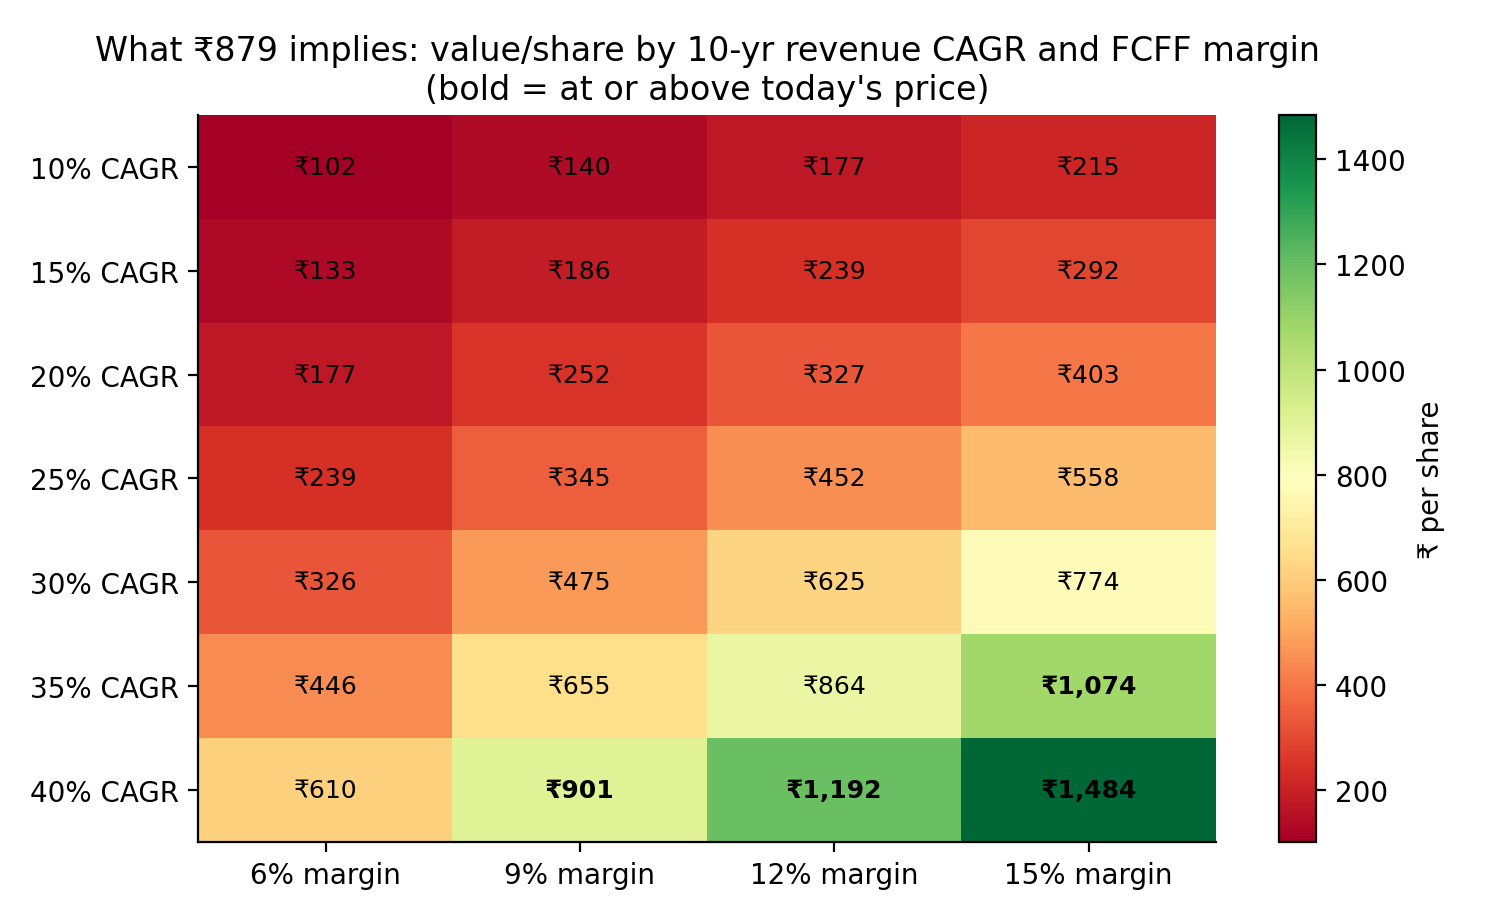
Value per share by 10-year revenue CAGR and FCFF margin (WACC 14.8%, terminal growth 6%). Bold cells are at or above ₹879.

What the bulls are right about

All of this is real, and most of the Street agrees. The question is whether it is worth 35% compounding for a decade; even after cuts, my forecast assumes more than Q1 FY27 delivered.

What would change my mind

Risks to the call

The commodity angle: raw materials are 69% of revenue. IEEMA's price-variation formulas, the industry's own cost weights for transformers and motors, put copper at ~27% and electrical steel at ~24% of CG's material cost once weighted by business mix. A 10% copper rise cuts EBITDA margin ~94 bps (7% of FY27E EBITDA) at 50% pass-through. Commodity costs were one reason Industrial Systems' margin fell from 12.8% to 10.6% in FY26 and 9.6% in Q1 FY27.
Every model output (DCF, sensitivity, reverse DCF, commodity grid) is rebuilt independently in Python and matches Excel exactly. Inputs verified against the FY26 annual report, Q4 FY26 call, Q1 FY27 results, IEEMA circulars and Screener.in; consensus from MarketScreener; prices are NSE closes on 1 Oct 2026. Full report: CGPower_Initiating_Coverage.pdf. Independent student research for learning purposes; not investment advice.